


Graphical Performance Reports obtained from OMR Sheet Checker Software
One of the special features of the OMR software is the graphical performance report. The software saves the results of each exam and after the evaluation of the final answer sheet, provides a detailed report of the entire examination. The report shows the marks of the entire test series in the numerical format as well as through graphs and pie diagrams. This helps the students and their parents to take a look at their performance graph.
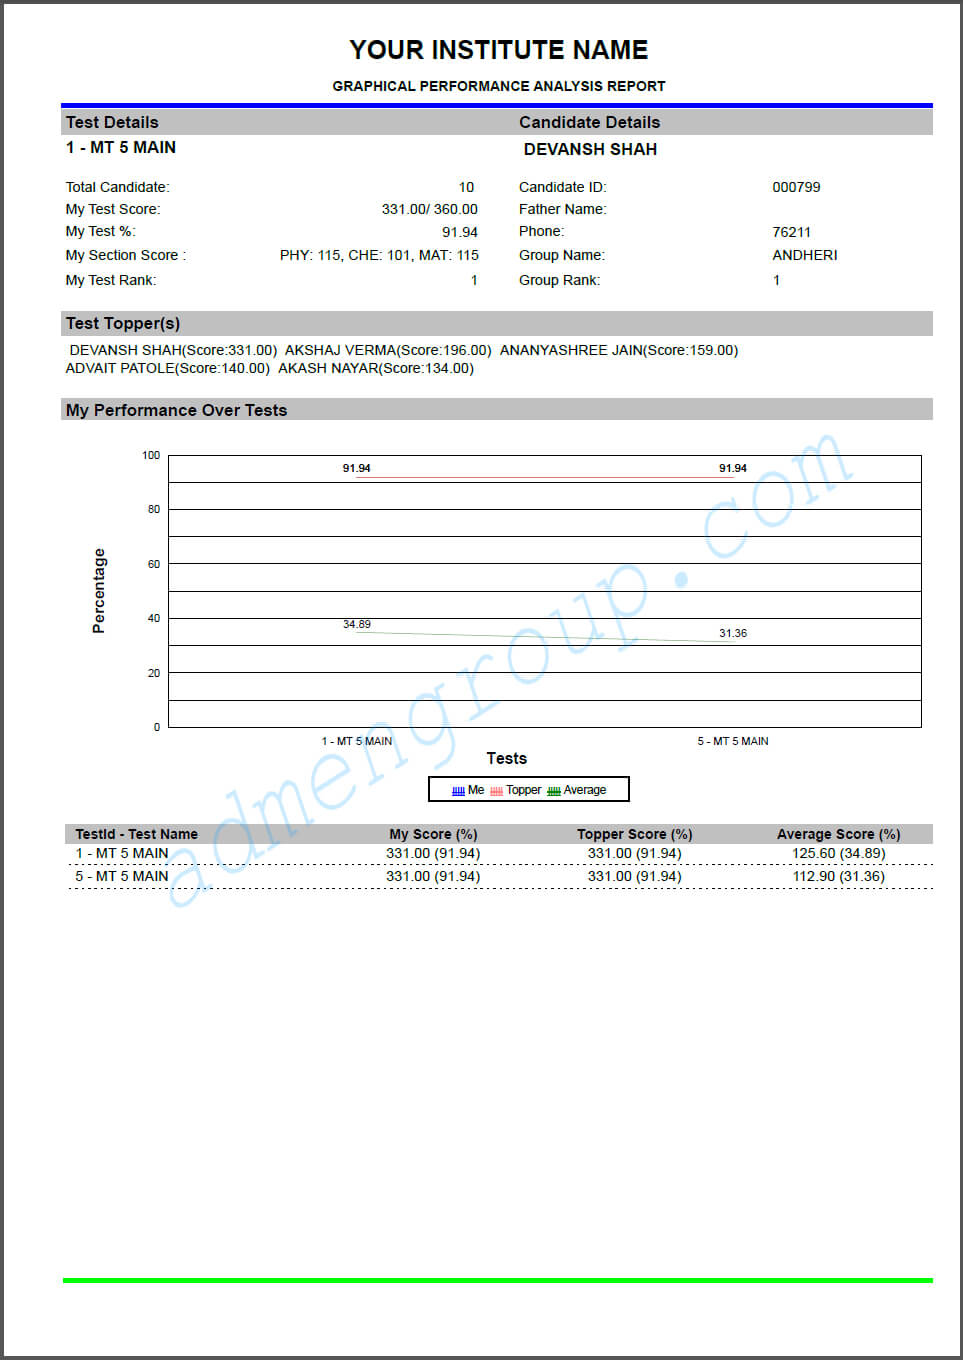
Parameters of graphical performance reportsStudent details: The student details section includes elements like the name of the student, name of the father, roll no. or candidate ID, etc. Question response: Here, you will find information like no. of attempts made by the candidate, answers provided by the student, answer key of the questions, classification of the questions as per difficulty level, etc. Individual performance parameters: This section includes performance parameters of the students. You will find things like rank, score, percentage, percentile, rank in individual tests as well as overall rank. Group performance parameters: Along with the individual scores of the students, these reports also provide group analysis reports. You will find the names and scores of five top performers of the test. Apart from this, it also provides information like minimum score, maximum score and average score.
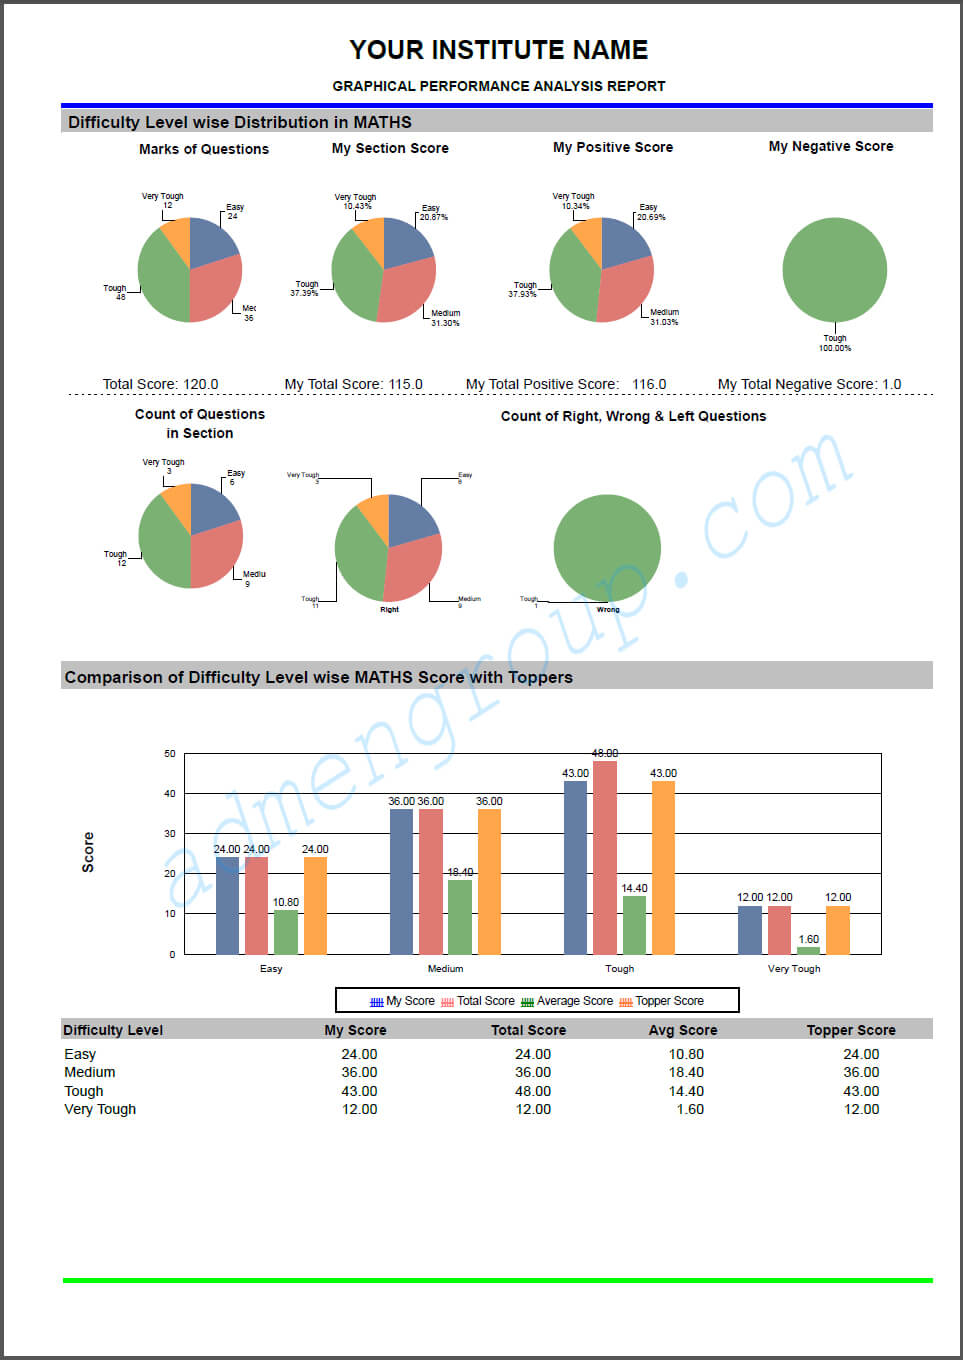
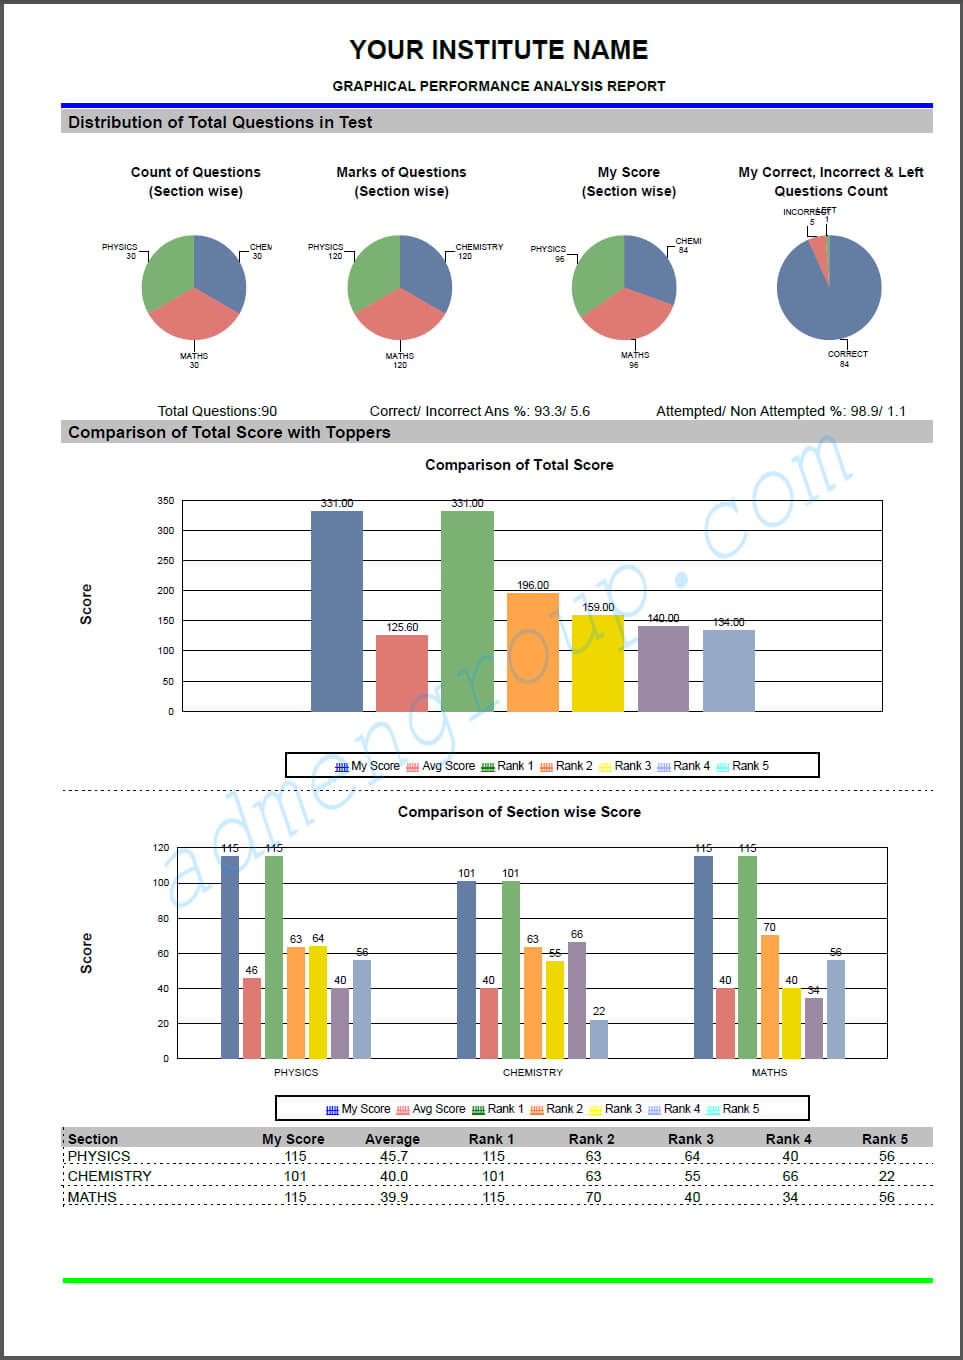
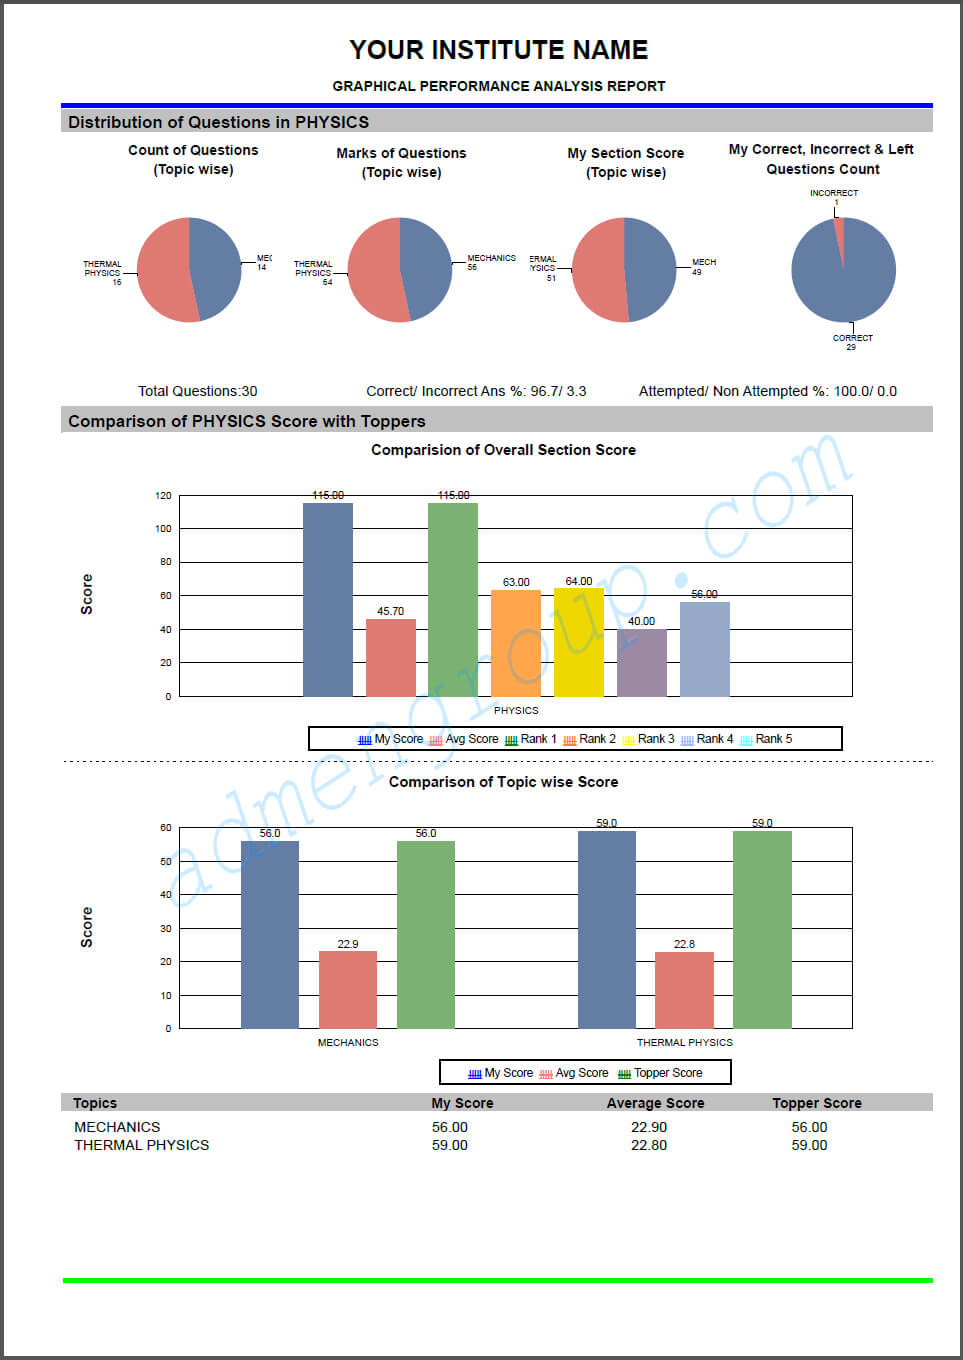
Graphical representationsHere are the elements that you will find in the graphical performance report of OMR sheets.
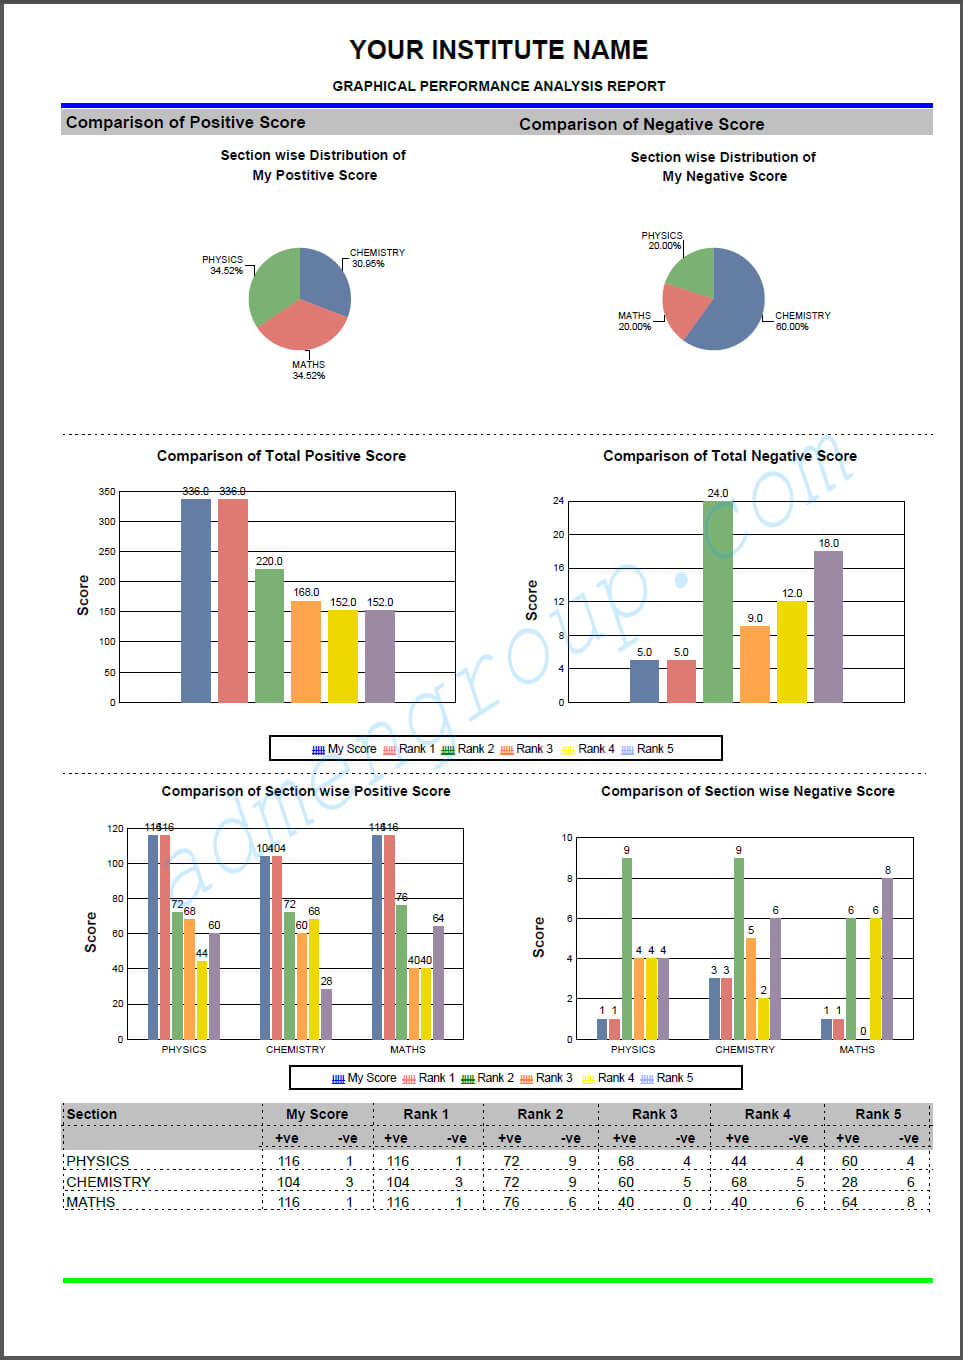
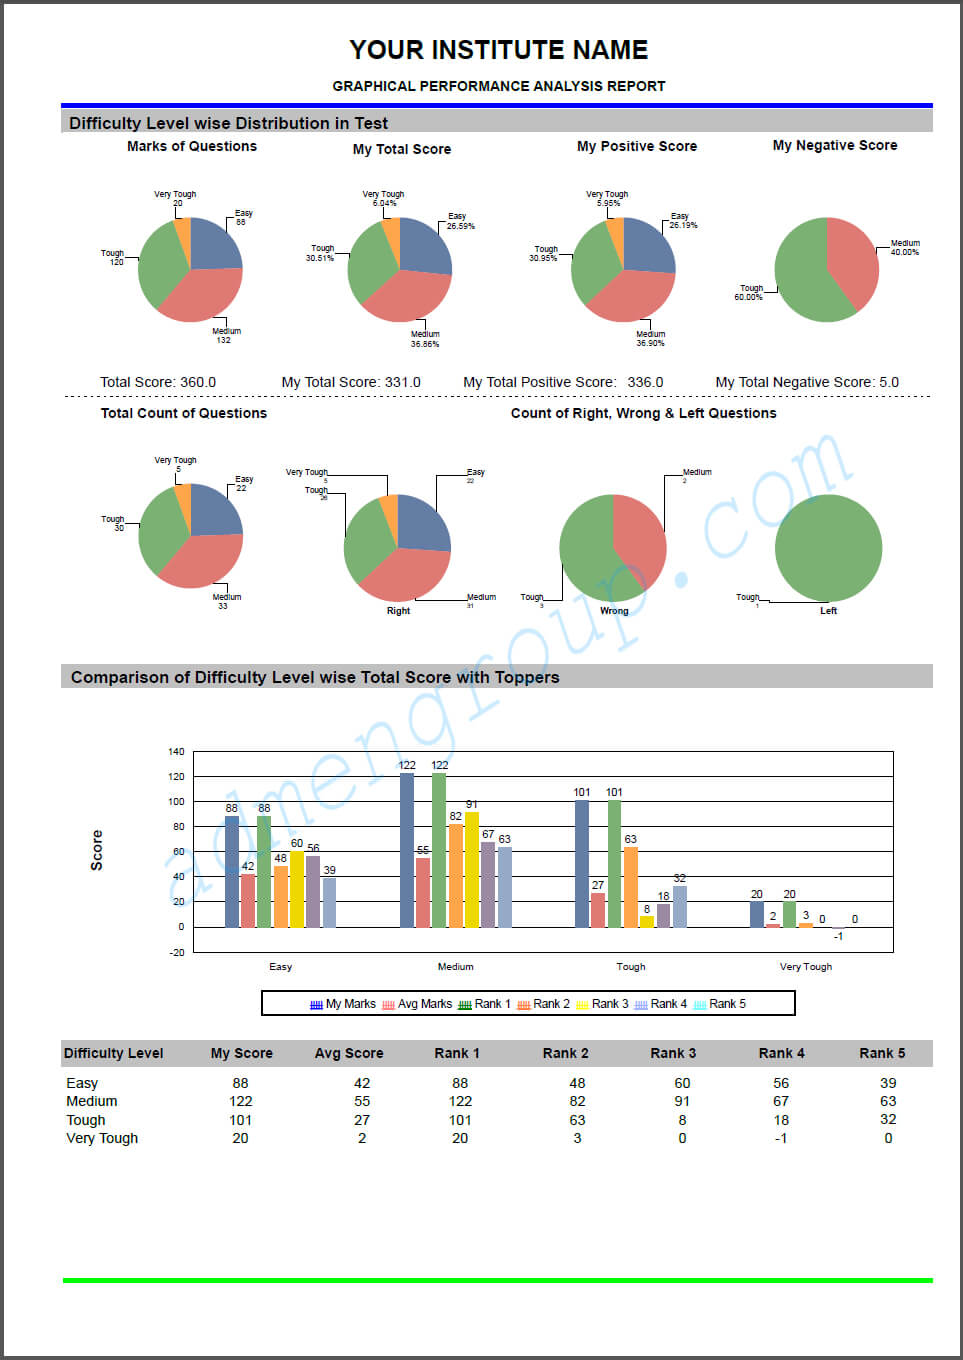
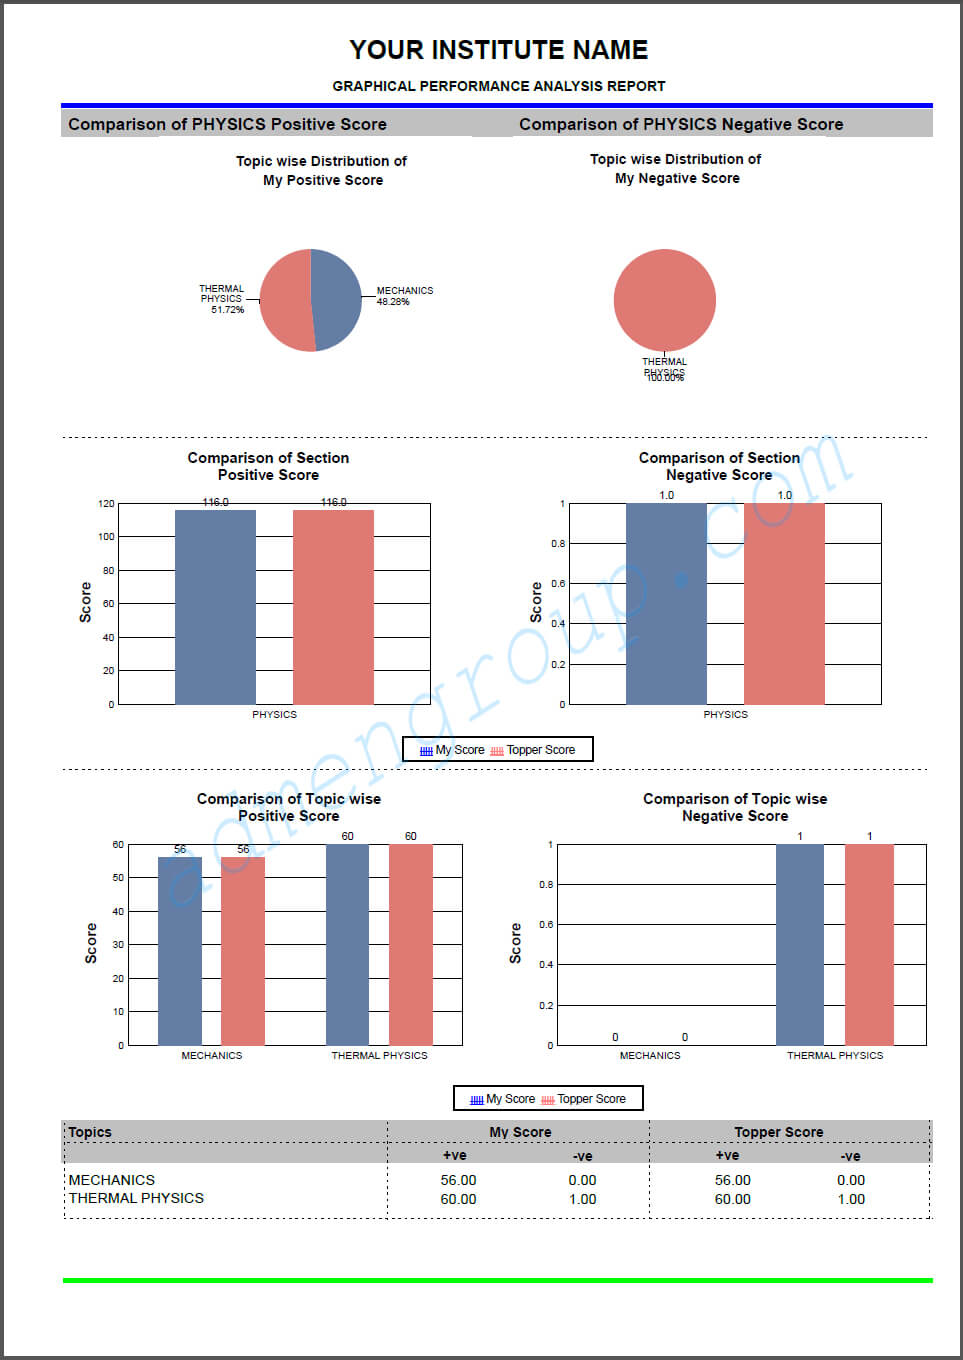
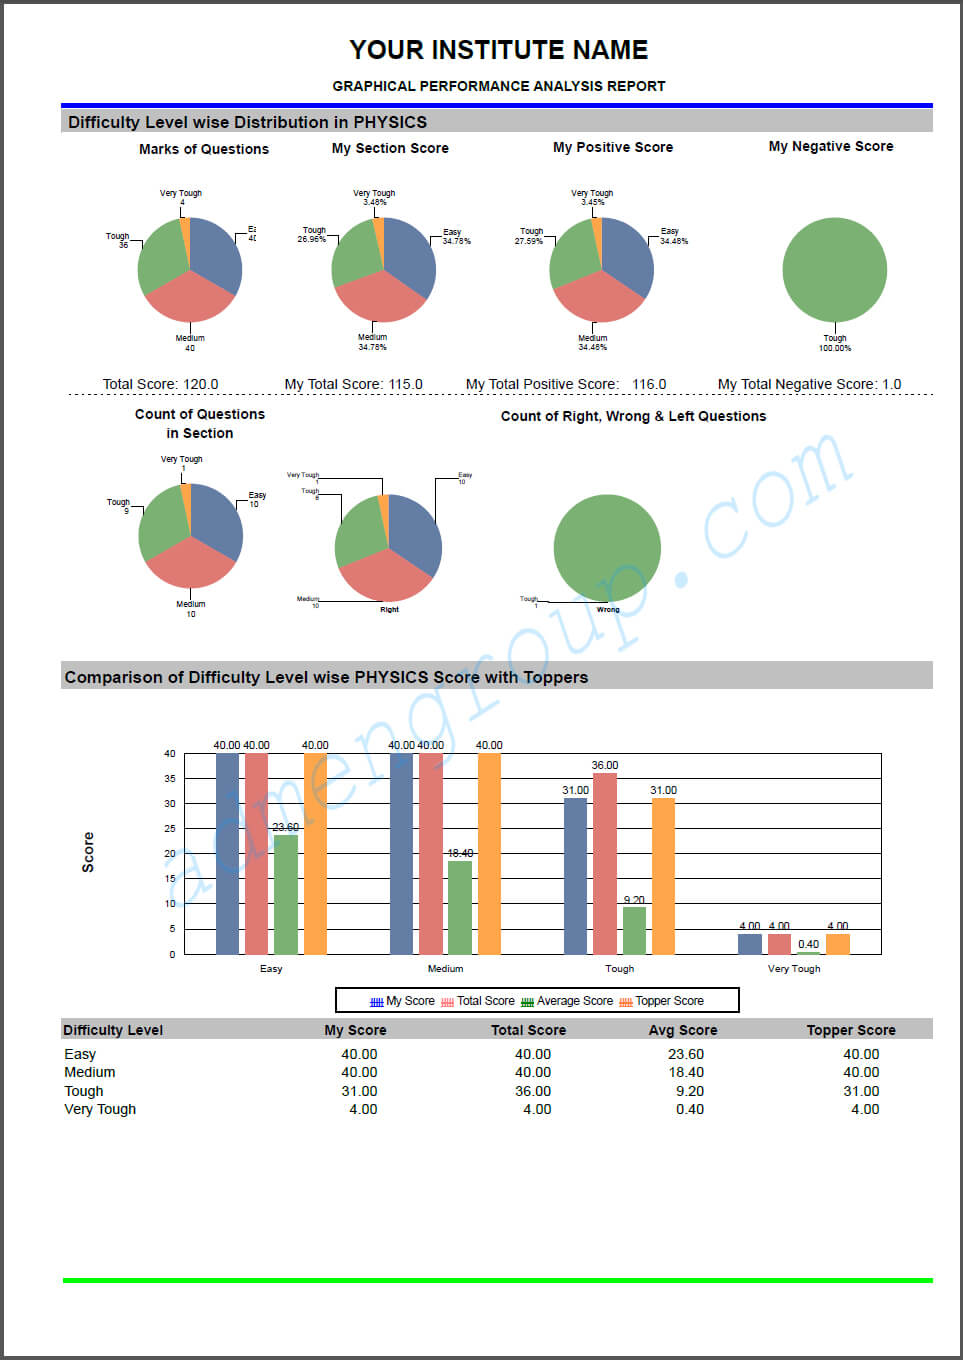
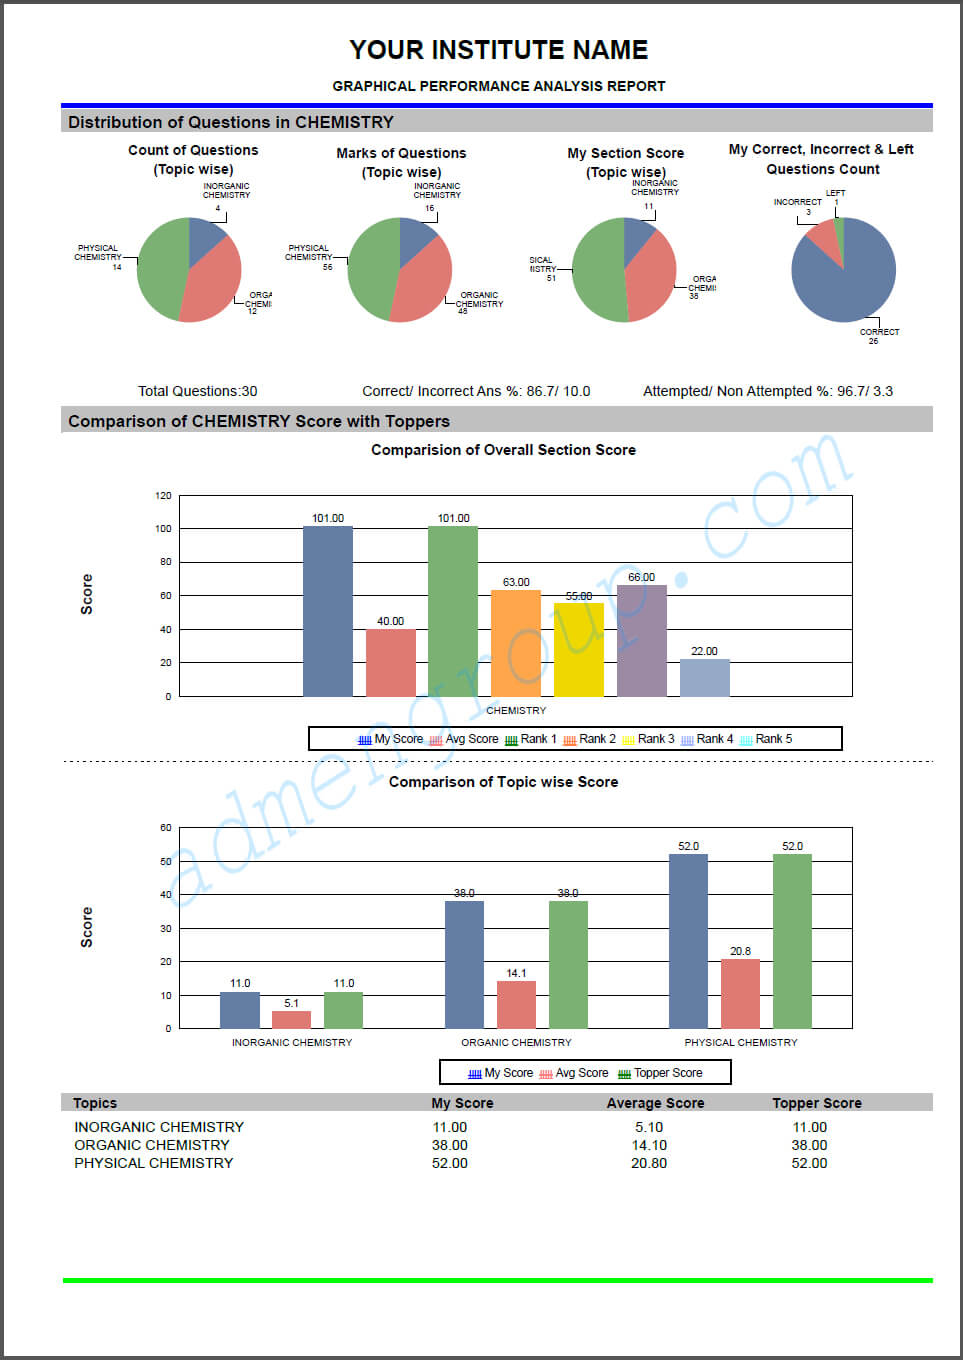
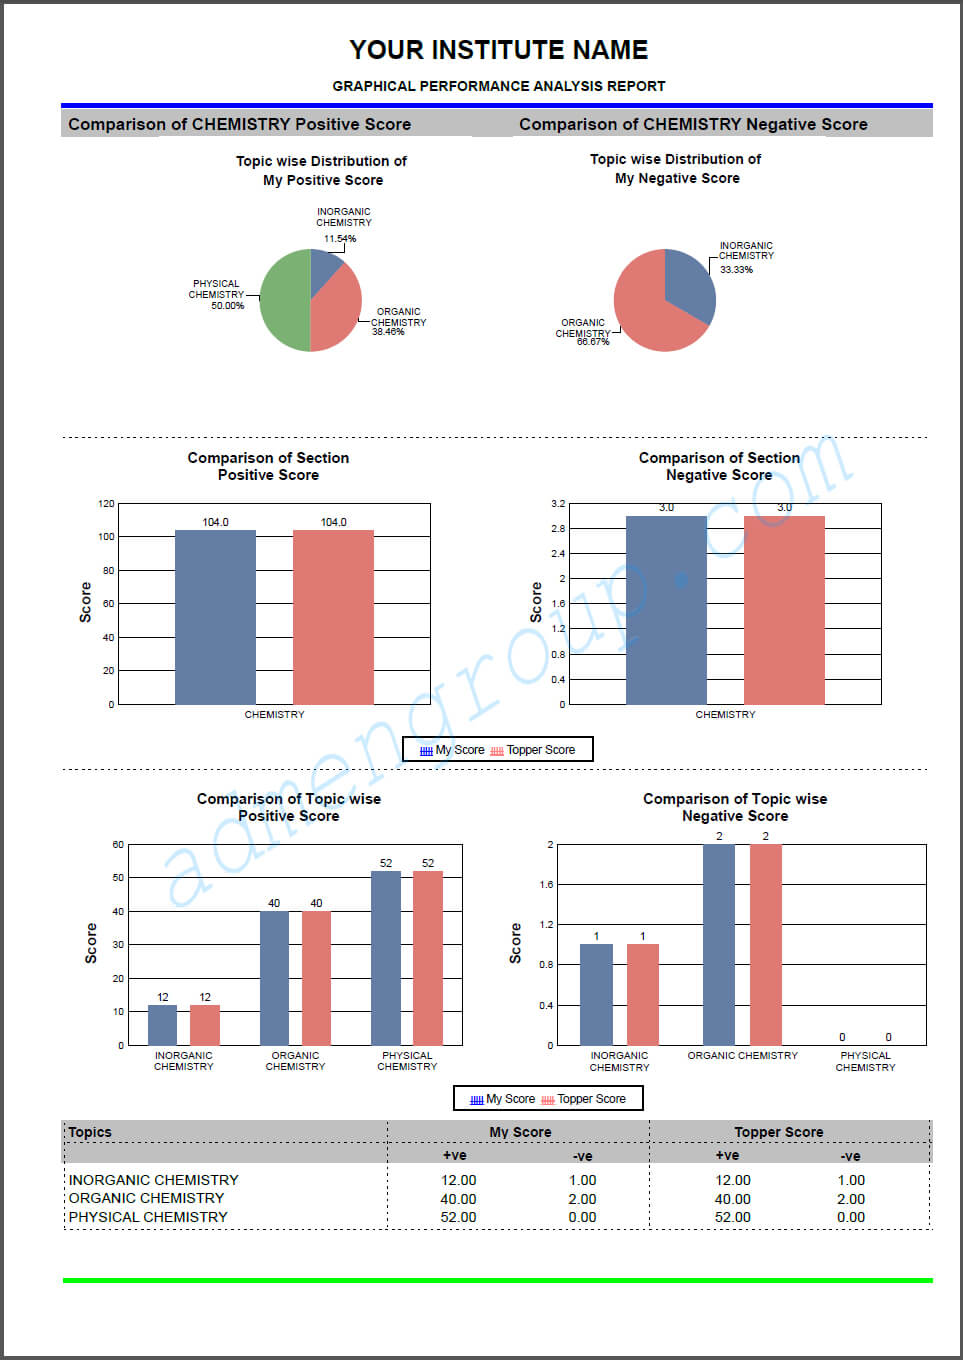
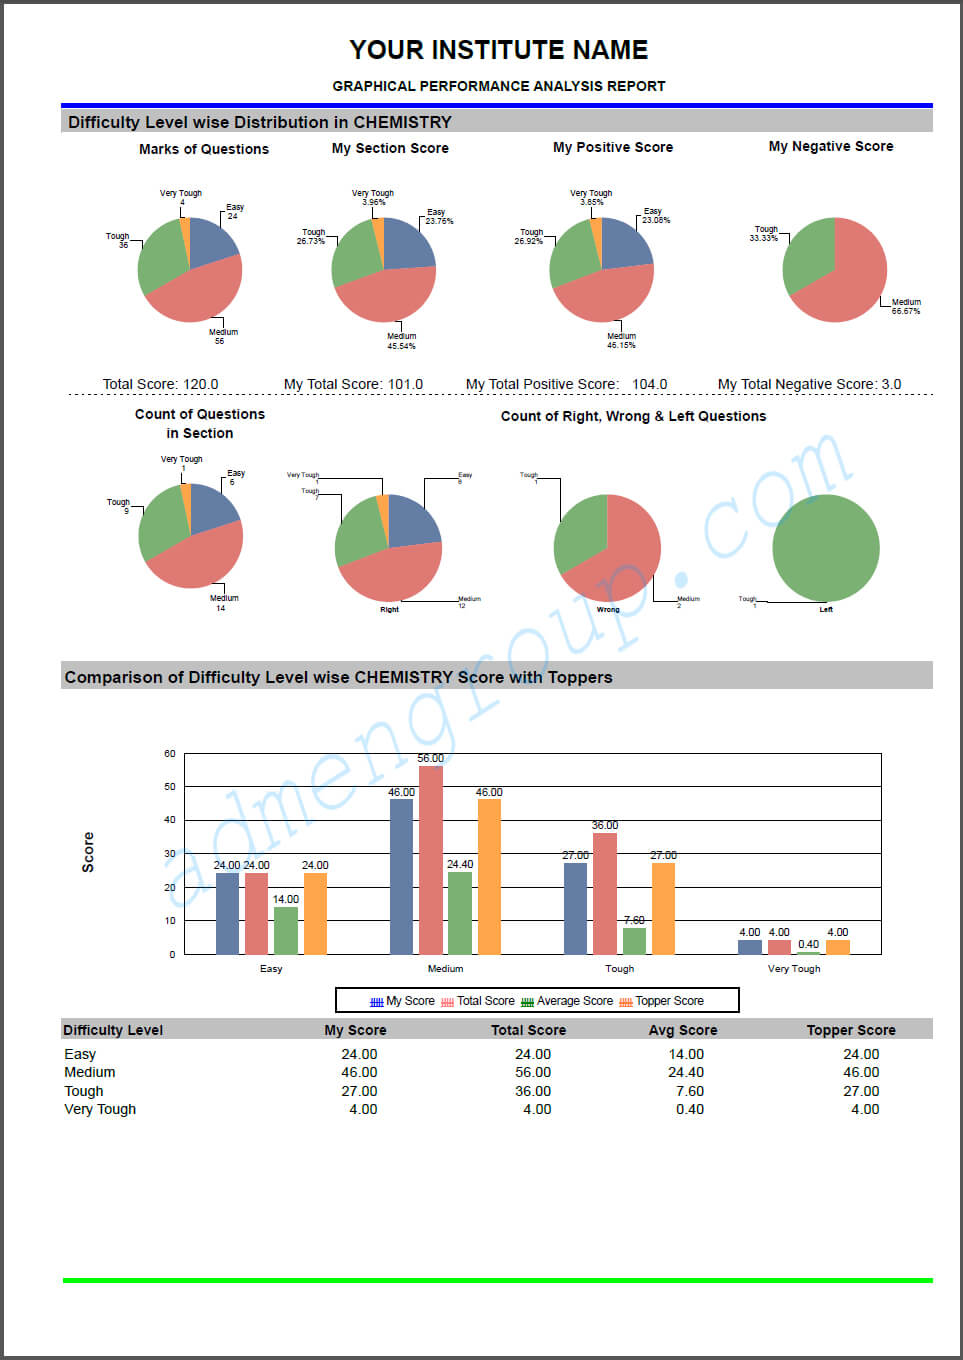
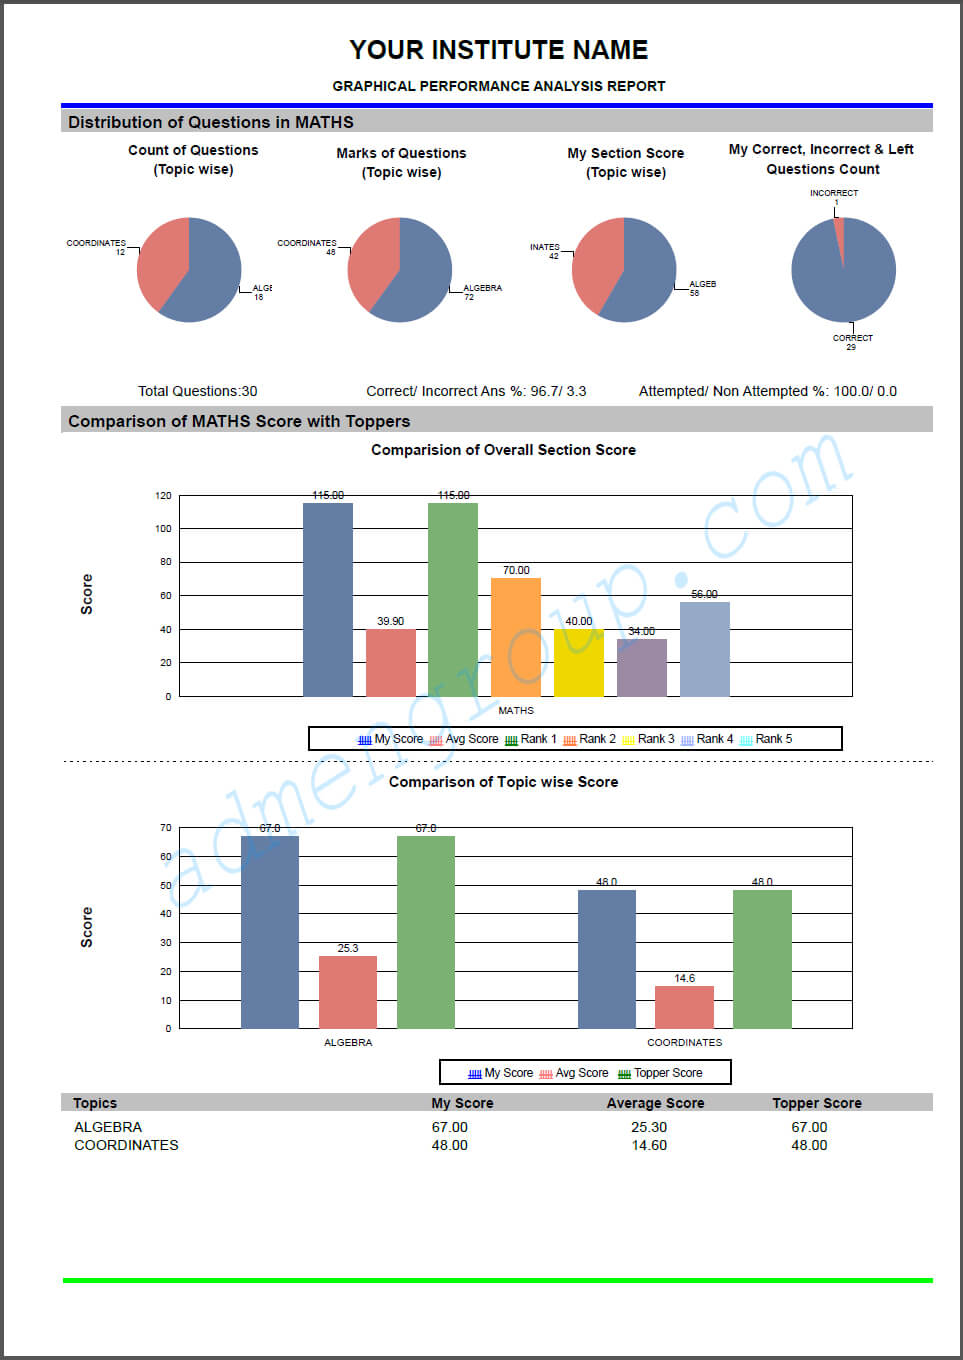
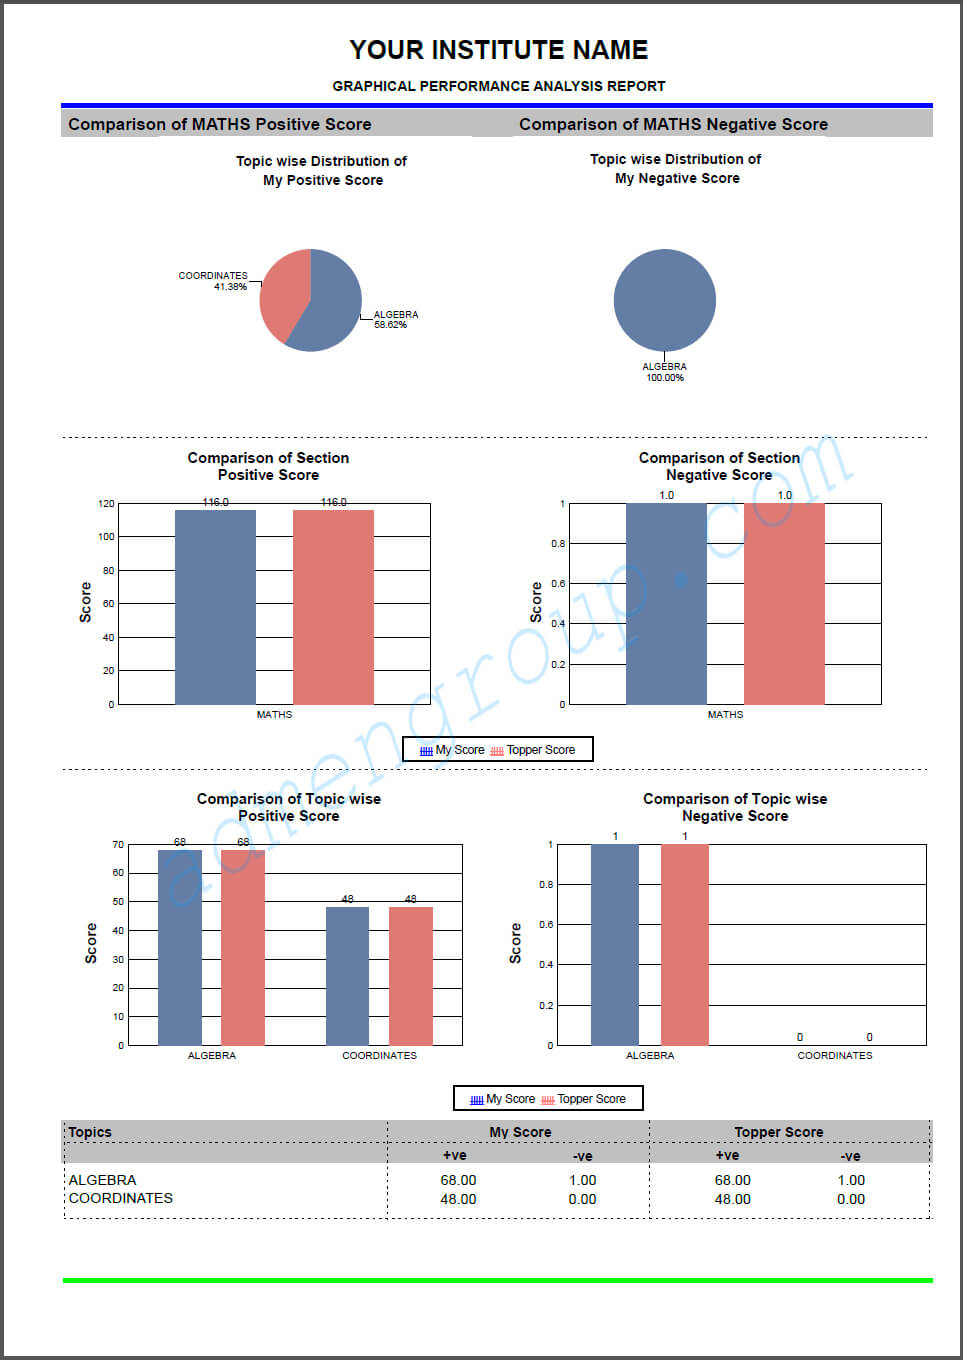
|